
INDEPENDENT QUANTITATIVE MARKET ANALYTICS
Filtering Signal from Noise.
Exploring financial markets through data, statistics, and interactive analytical tools.
Explore the Data
Explore financial markets from different perspectives. Examine intraday activity, identify unusual price-volume behavior, and understand the stocks driving broader index movements.
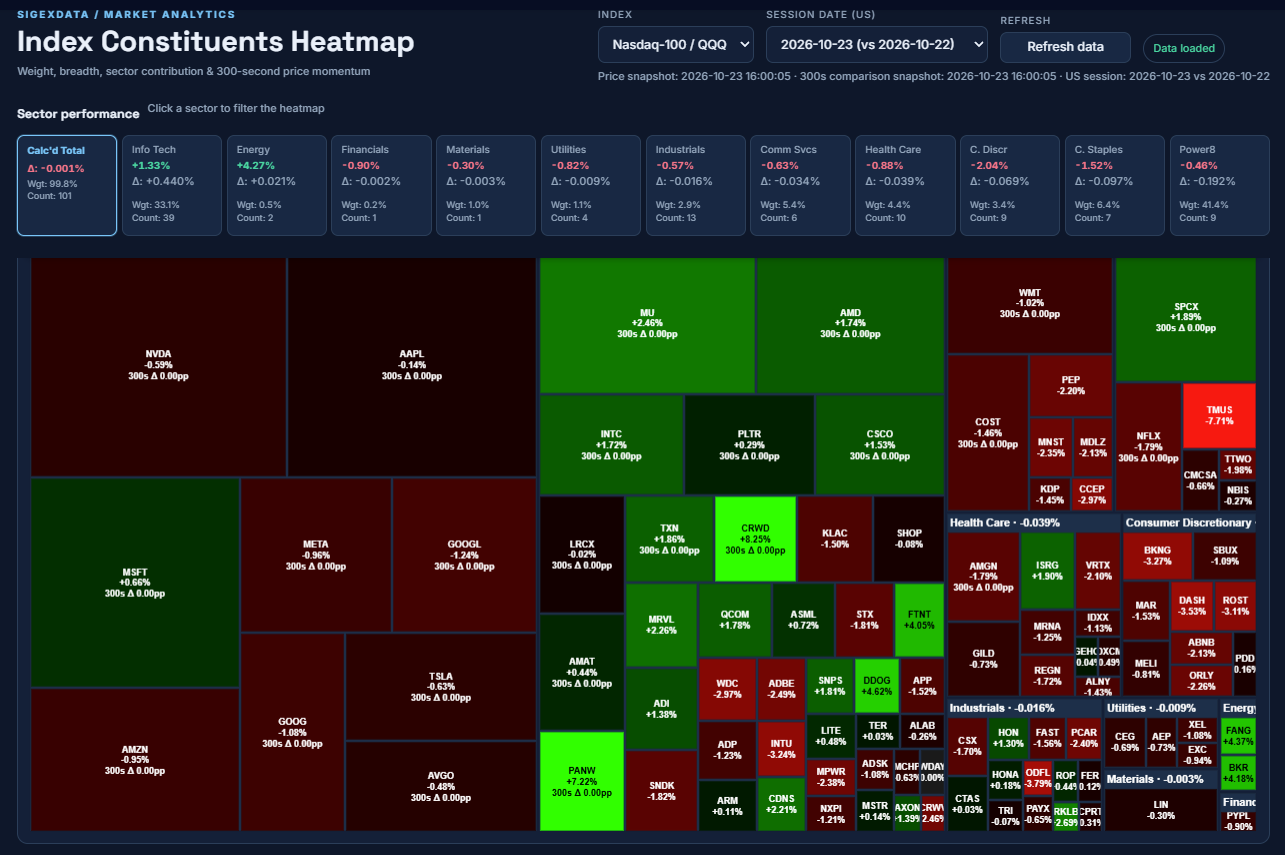
Index Constituent Heatmap
Explore SPY and QQQ constituent performance through interactive heatmaps. Identify which companies and sectors contribute to index movements while examining price changes, market concentration, and relative trading activity.
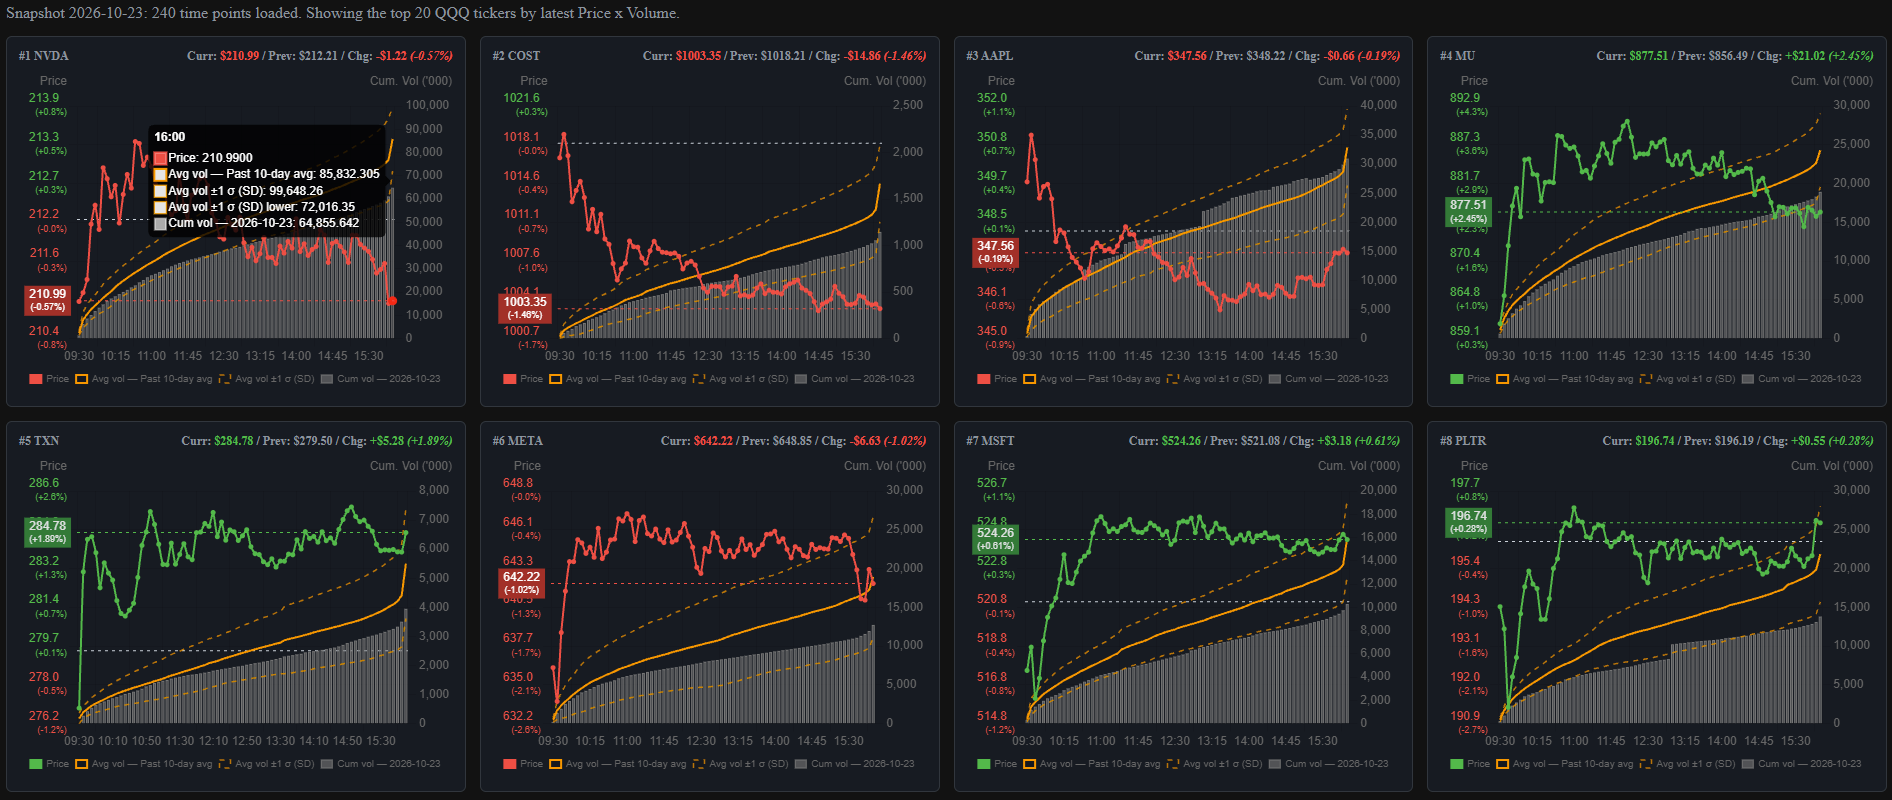
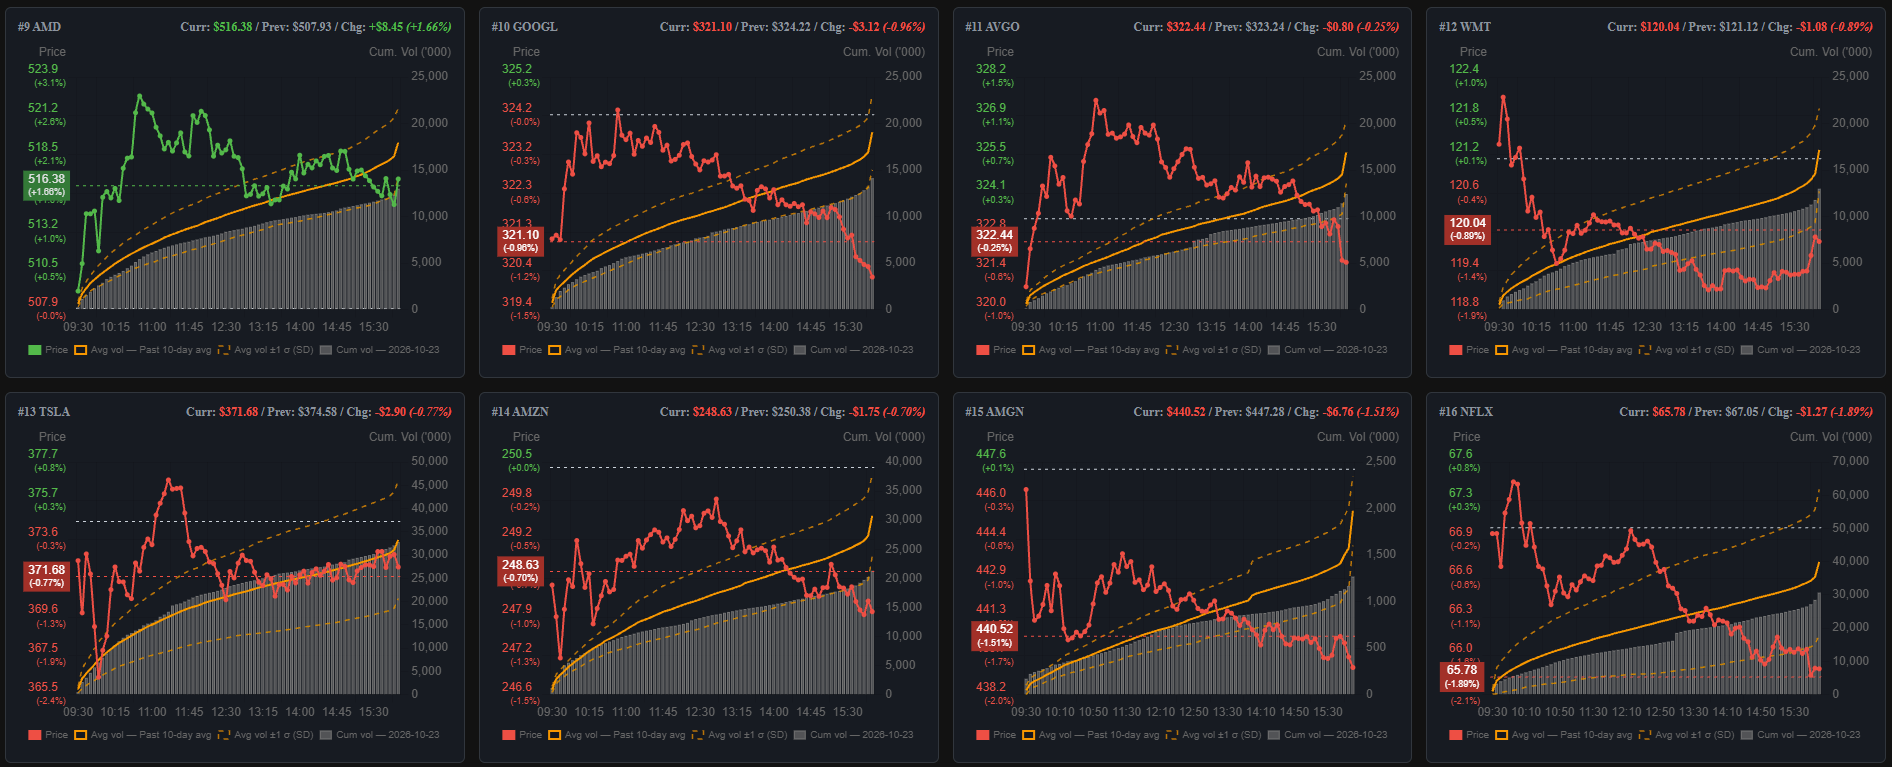
Intraday Price & Volume Monitor
Track intraday price movements alongside cumulative trading volume, benchmarked against the previous 10 trading days. Compare current activity with historical averages and volatility bands to identify unusual participation throughout the trading session.
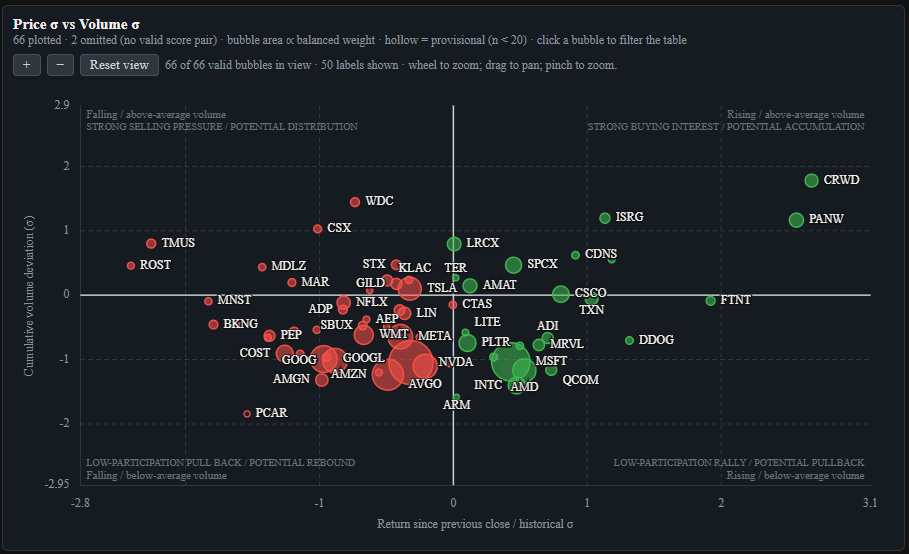
Price × Volume Signal Map
Identify unusual price movements and trading activity by comparing standardized returns and cumulative volume against historical patterns. Explore market participation, potential accumulation or distribution, and emerging divergences across index constituents.
OUR METHODOLOGY
From Data to Insight
Market movements are easy to observe. Understanding whether those movements are unusual, meaningful, or simply part of normal market behavior requires context. SigExData approaches this through three principles.
01 — Collect & Prepare
Build a consistent foundation from market prices, trading volumes, and index constituent data. Align observations, handle missing data, and organize datasets for meaningful comparisons.
02 — Compare & Quantify
Measure current market behavior against historical baselines. Use standardized statistics, time-of-day comparisons, and constituent-level analysis to distinguish ordinary variation from unusual activity.
03 — Interpret & Question
Explore what the evidence may indicate, while recognizing the limits of statistical signals. Examine market breadth, concentration, and price-volume relationships without confusing correlation with certainty.
Our aim is not to predict every market movement, but to make market behavior easier to examine, compare, and question.
OPEN TO COLLABORATION
Explore. Experiment. Collaborate.
SigExData is an independent, enthusiast-driven project exploring financial markets through data, statistics, and technology. We're open to exchanging ideas, collaborating on research, and connecting with others who share our curiosity.
Research & Ideas
Exchange ideas, challenge assumptions, and explore quantitative approaches to understanding financial markets.
Data & Collaboration
Share datasets, methodologies, technical expertise, and opportunities to develop better analytical tools.
Support the Project
Open to research sponsorship, data partnerships, and other forms of support that help sustain independent experimentation.